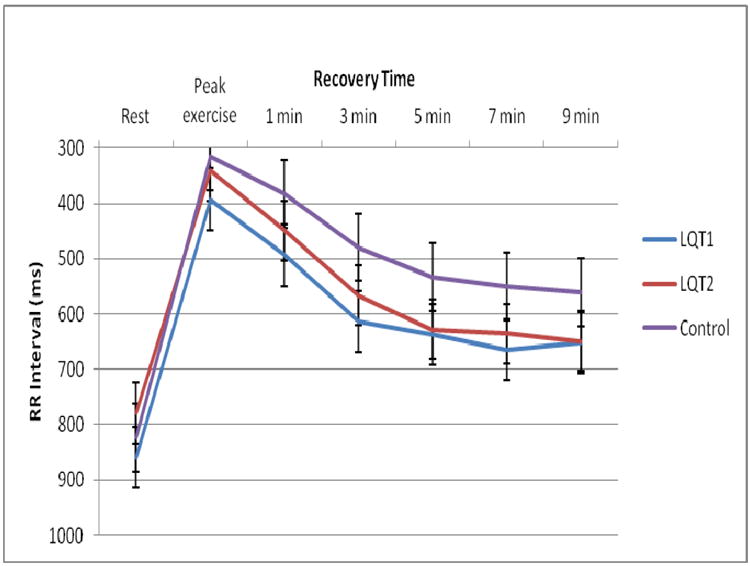
Figure 3.

RR Intervals Plotted Against Time. Shown are the average RR intervals (ms) plotted against time (rest, peak exercise, 1, 3, 5, 7 and 9 minutes of recovery). Standard error bars are included. Shown are differences in RR intervals in the LQT1 and LQT2 groups vs controls reflective of beta-blocker therapy. Note, RR intervals do not return to resting values at end recovery (9 minutes).
