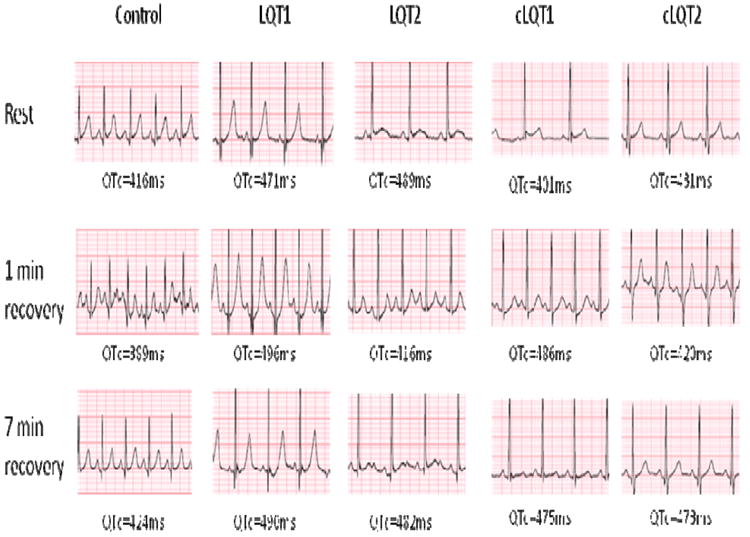
Figure 5.

ECG Tracing in LQTS Patients During EST. Examples of ECG tracings reflect gene specific repolarization responses. The control patient had a normal resting QTc (416ms) which shortened in early recovery (389ms) and returned to near baseline at 7 minute recovery (424ms). The LQT1 patient has characteristic QTc prolongation at rest (471ms) which prolonged further in early recovery (496ms) and remained prolonged at 7 minute recovery (490ms). The LQT2 patient also had characteristic QTc prolongation at rest (489ms) which shortened in early recovery (416ms) and prolonged at 7 minute recovery (482ms). The cLQT1 and cLQT2 (concealed LQT) had similar patterns.
