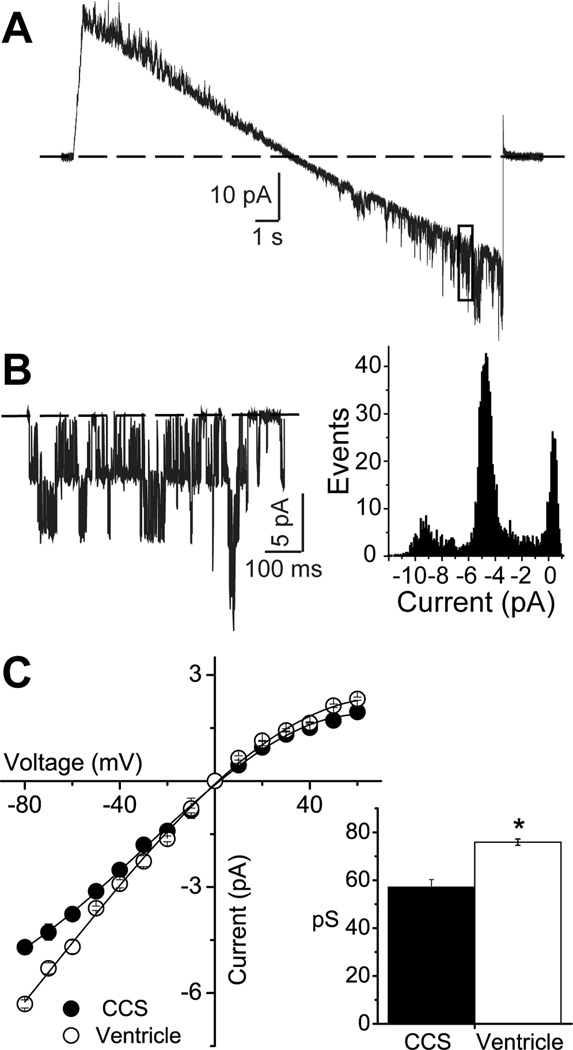
Figure 1.
The unitary conductance of KATP channels recorded from mouse cardiomyocytes originating from the cardiac conduction system (CCS) and the ventricle. A) A representative trace of CCS KATP channel unitary events recorded during a voltage clamp ramp (111 mV/s) from −100 to 100 mV. B) Following baseline subtraction, the region of the current marked by the box (membrane potential around −80mV) is shown. Also shown is an all-points histogram for this current section. C) Current-voltage relationship of the unitary current amplitude for KATP channels recorded from CCS or ventricular myocytes. Inset: slope conductances (mean±SEM), measured between −80 and −20 mV. *p<0.05; Student’s t-test.

