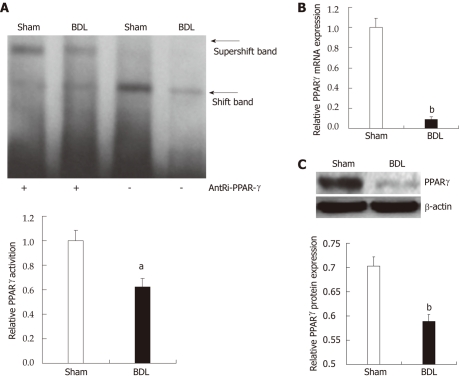
Figure 1.
Modified measurement of peroxisome proliferator-activated receptor-γ activation and expression upon bile duct ligation and consequent cholestasis. A: Electrophoretic mobility shift assay (top panel) of peroxisome proliferator-activated receptor (PPAR)-γ. DNA binding in nuclear extracts from liver, and relative densitometric analysis (lower panel). Data are expressed as mean ± SE (n = 3). aP < 0.05 for bile duct ligation (BDL) group vs sham group; B: PPAR-γ mRNA expression in the liver. PPAR-γ expression in the liver of BDL rats decreased significantly compared with the sham-group determined by quantitative real-time reverse transcription-polymerase chain reaction. Data are expressed as mean ± SE (n = 6). bP < 0.01 for BDL group vs sham group; C: Western blotting analysis (top panel) of PPAR-γ in nuclear extracts from liver, and relative densitometric analysis (lower panel, n = 3). Data are expressed as mean ± SE (n = 3). bP < 0.01 for BDL group vs sham group.

