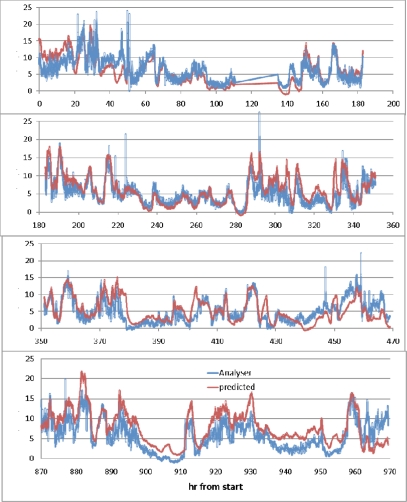
Figure 19.
Graph comparing the responses of chemiluminescence and semiconductor sensors. Measurements were simultaneous and made every minute. X-axis indicates hours since experiment start and y-axis ppb concentration of NO2. Figure adapted with permission from [73].

