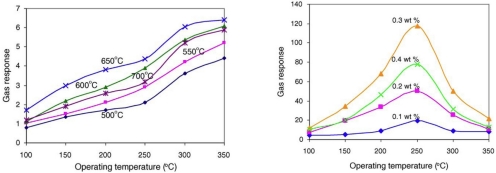
Figure 20.
Left, The responses (as %) of pure ZnO thick films fired at varying temperatures to 1,000 ppm of ammonia. Right, showing the optimum operating temperature for ZnO films for sensing 1,000 ppm ammonia with RuO2 doping. Figure adapted with permission from [78].

