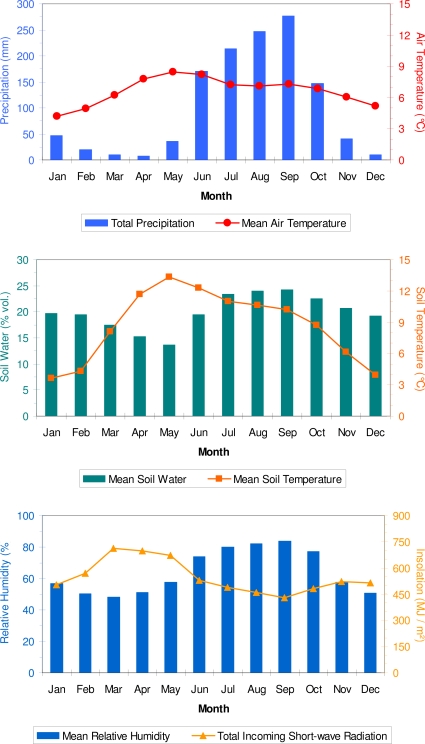
Figure 2.
Climatic diagrams showing average monthly variables based on 2002–2008 data from the automated weather station. Soil data were collected at about 30 cm below ground, precipitation at about 1 m above ground, air temperature and relative humidity at about 2 m above ground, and total insolation at about 3 m above ground.

