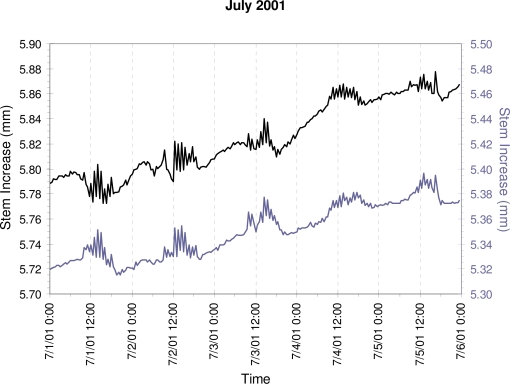
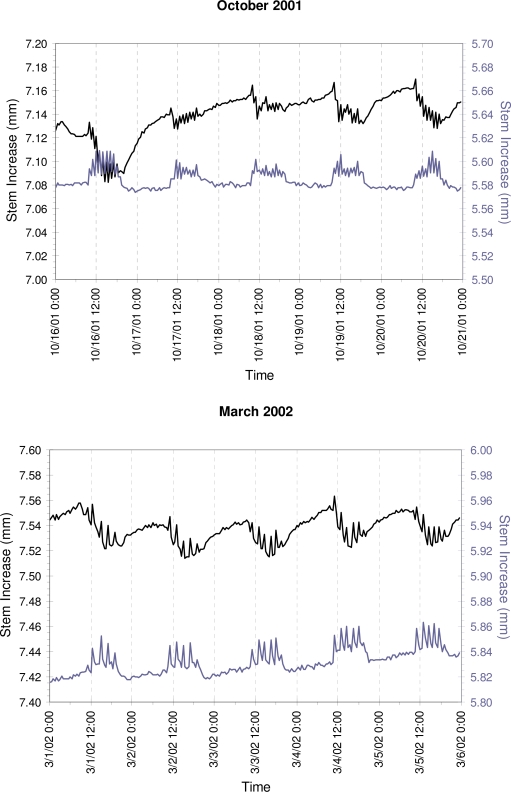
Figure 4(a).
Stem size patterns recorded on two trees at Site 1; line colors (black and gray) identify the same trees in all graphs. Half-hourly measurements during five consecutive days in selected months, with x-axis tick marks at six-hour intervals, and dashed vertical lines marking noon and midnight. Expansion occurs mostly during the night and morning, followed by relatively large oscillations in stem size during the afternoon, and by a more regular contraction during the evening.


