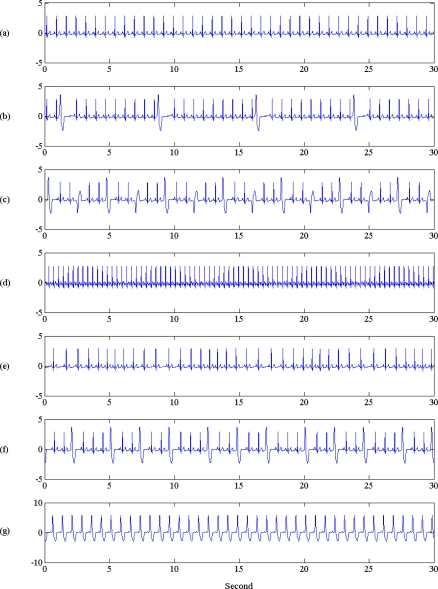
Figure 2.
Illustration of normal and arrhythmia ECG signals used in this study. Signal durations are 30 s. From top to bottom: (a) normal ECG, (b) premature arrhythmia with PVC1, denoted as P1, (c) premature arrhythmia with multifocal PVC, denoted as P2, (d) superavent arrhythmia with atrial tach, denoted as S1, (e) superavent arrhythmia with sinus arrhythmia, denoted as S2, (f) ventricular arrhythmia with 24 PVCs per min, denoted as V1, (g) conduction arrhythmia with Lf bundle branch block, denoted as C1.

