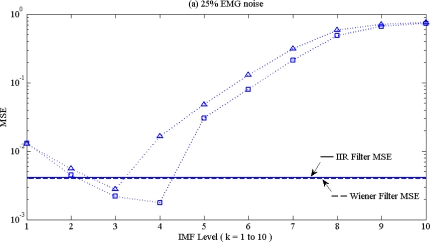
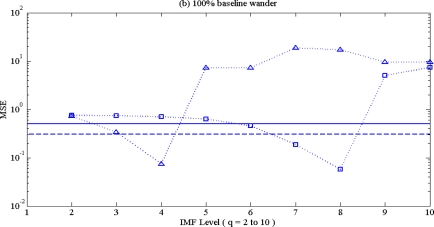
Figure 6.
MSE distribution of ventricular arrhythmia ECG (V1) with (a) 25% EMG noise, (b) 100% baseline wander for EMD (dot line with triangle mark), EEMD (dot line with square mark),on different IMF levels. Corresponding MSE of Wiener filter (dash line) and IIR filter (solid line) with low pass filter spec are also shown in (a) and in (b) with high pass filter spec. The minimum MSE of EMG noise is at k = 3 for EMD and k = 4 for EEMD, and minimum MSE of baseline wander is at q = 8 (EEMD) and q = 4 (EMD), respectively.


