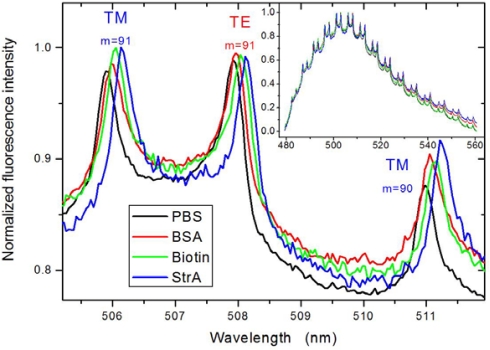
Figure 3.
WGM spectra obtained from a single surface-adsorbed fluorescent polystyrene bead with a nominal diameter of 10 μm in dependence of the same sequence of biomolecules adsorbed onto the particle surface as used in the SPR study; the inset shows the overview over the entire emission wavelength range of the fluorescent dye applied, while the main figure displays a close-up of the most intense modes. The latter are labeled according to their respective polarization (TM/TE) and mode number m. It should be noted that under the given conditions, only 1st order modes are observable. PBS—phosphate buffered saline, BSA—bovine serum albumin, StrA—streptavidin.

