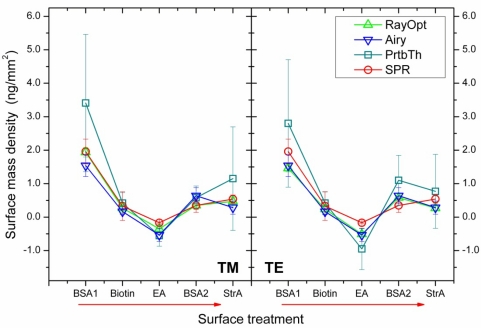
Figure 6.
Surface mass densities adsorbed in the different steps of the biomolecular adsorption experiment as determined by SPR and the WGM sensor. For evaluation of the WGM sensor data (cf., Table 1), three different models were applied: RayOpt—ray optics model, Airy—Airy model, PrtbTh—perturbation theory.

