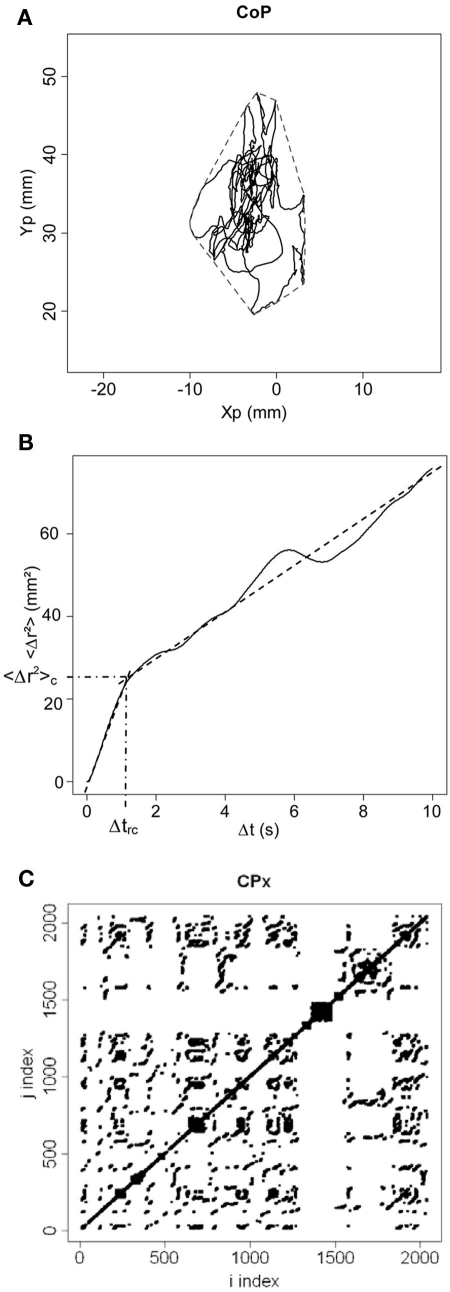
Figure 1.
(A)Statokinesigram of center-of-pressure (CoP) displacements. Anteroposterior displacements of the CoP (Yp) are plotted against mediolateral displacements (Xp) in millimeters (mm). The convex hull area is shown in dotted line. (B) Stabilogram-diffusion plot. We show the mean square CoP displacement (<Δr2>) in mm2 as a function of time interval (Δt) in seconds. Experimental data is shown in full line, and theoretical fitting for the first and second regressions is shown in dotted line. The critical point between the two regressions is indicated by its coordinates (emphasized by semi-dotted lines) on the x axis (Δtrc) and on the y axis (<Δr2>c). (C) Recurrence quantification analysis plot. In this example, the phase space is shown for mediolateral fluctuations (CPx) for a radius of 3%. Thus, for a sphere of radius equal to 3% of the mean distance between data points of the phase space, we calculated for i = 1 − N and j = 1 − N (where N is the total number of data points) the distance between data points x(i) and x(j), and darkened every recurrent point for which the distance was below the radius. For i = j, the distance is zero resulting in the central diagonal line.

