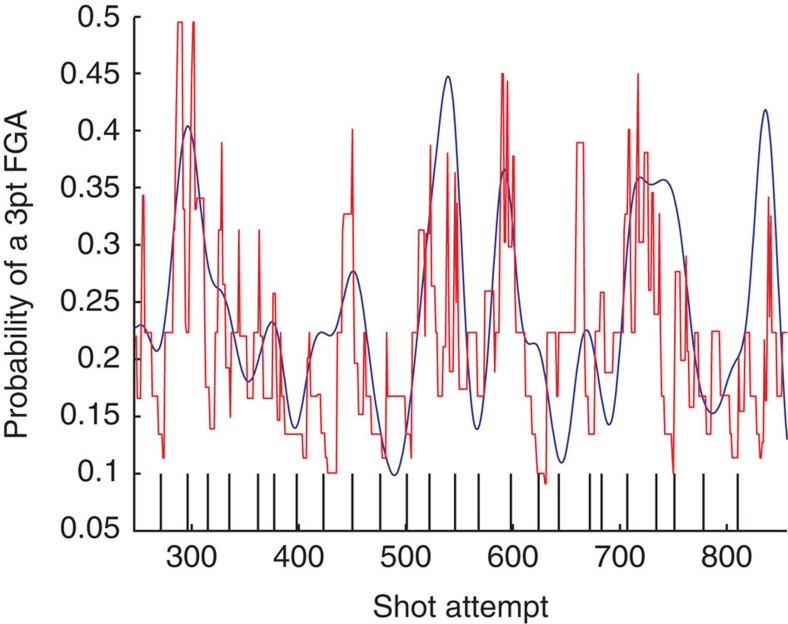
Figure 2. A model of the learning behaviour of the MVP in 24 games in the 2007–2008 season.
In blue, the empirical probability for a 3pt, computed by smoothing the attempted shots (a vector in which '1' indicated a 3pt attempt and '0' indicated a 2pt attempt) with a Gaussian filter whose s.d. was 10 FGAs. In red, the model prediction of 3pt probability as a function of FGA number, where numbers are counted from the beginning of the season. Black vertical lines indicate the beginning of a game. The similarity between the red and blue lines illustrates that the model captures some of the variation in the 3pt probability over time.

