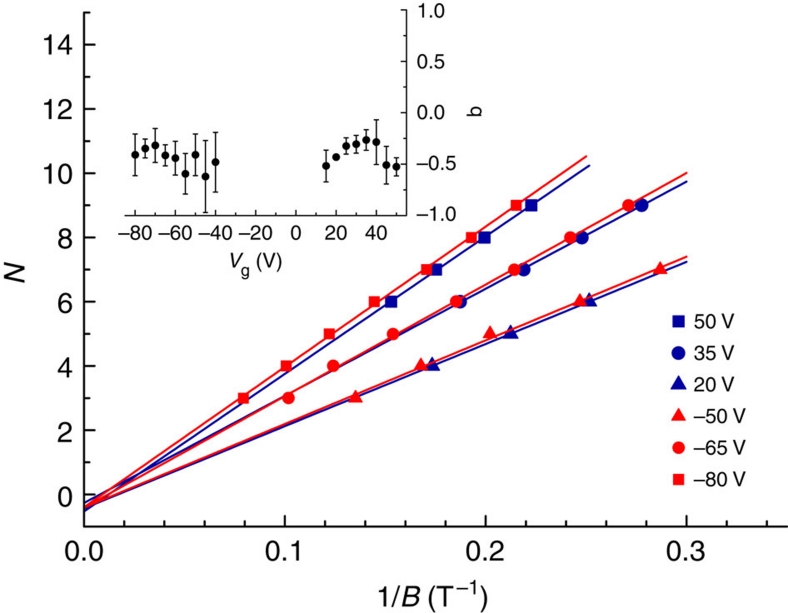
Figure 4. Massless Dirac character of surface fermions.
Main panel: Landau level index N versus 1/B plotted for selected values of gate voltage, corresponding to different concentrations of holes (red symbols) and electrons (blue symbols). According to the relation characteristic for massless Dirac fermions,  , where n is the density of charge carriers (electrons or holes), whereas for normal fermions
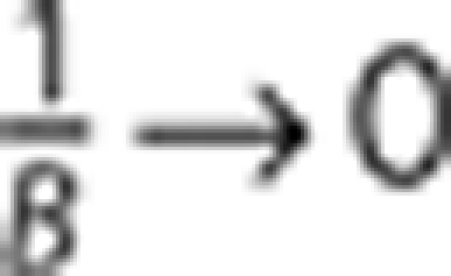
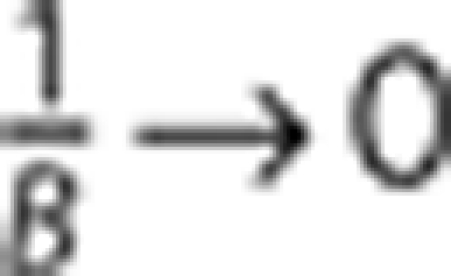
  . Therefore, looking at how N extrapolates for
  allows us to discriminate between massless Dirac and normal fermions. The continuous lines are linear least square fits to the data
  . They show that as
  ,N extrapolates to close to −1/2 as expected for massless Dirac fermions. The inset shows the extrapolation value (b) obtained by least square fitting for ~20 different values of gate voltage (in the region with Vg in between ~−40 and +15 V, the oscillations are not sufficiently pronounced to perform the analysis). The data show that b fluctuates close to −1/2 (and not around 0). Consistently, the average of b over gate voltage is ‹b›=−0.4±0.1.

