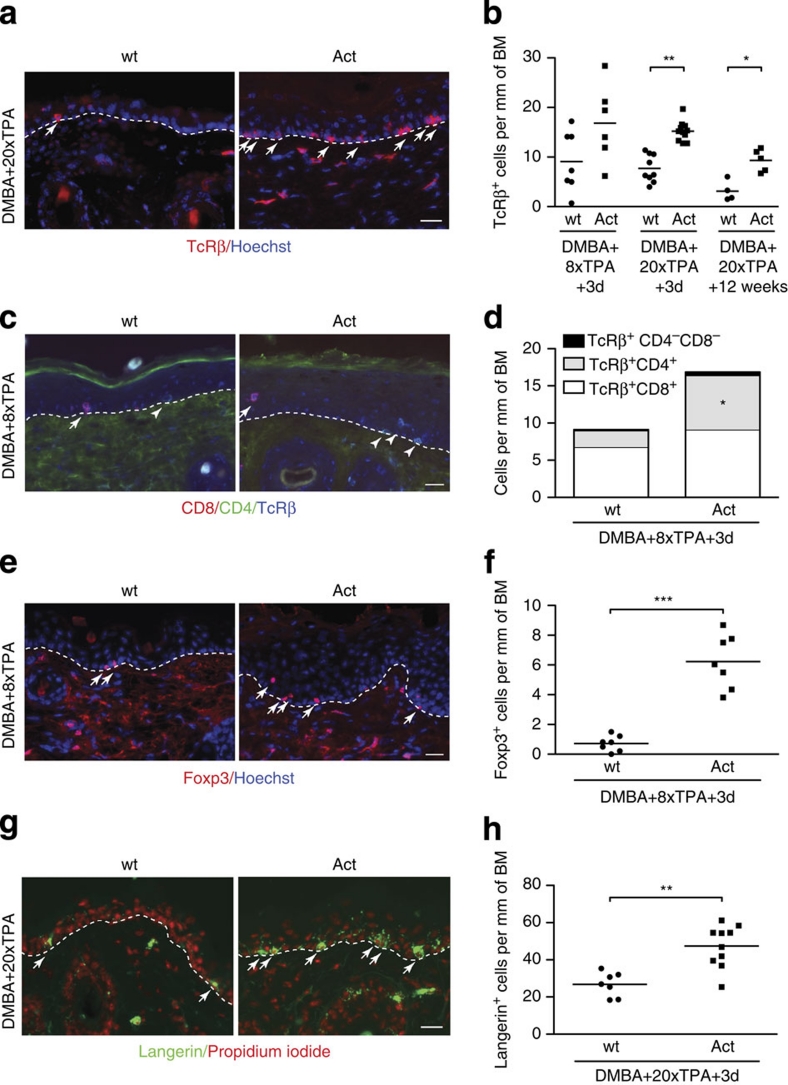
Figure 6. Accumulation of αβ T cells and Langerhans cells in the epidermis of activin-overexpressing mice.
(a,b) Sections from back skin at different time points of TPA treatment stained with TcRβ antibodies. (a) Arrows indicate TcRβ+ cells. (b) TcRβ+ cells per mm of basement membrane (BM). N=4–11 mice per group; n=3–25 microscopic fields of skin sections per mouse; *P=0.0159; **P=0.0022 (Mann–Whitney test). (c,d) Sections from back skin after eight TPA applications stained with antibodies against CD8, CD4 and TcRβ. (c) Arrows and arrowheads indicate CD8+ or CD4+ cells, respectively. (d) Different subpopulations of T cells per mm of BM. N=6–7; n=4–24; mean values are shown; *P=0.01 for comparison of TcRβ+CD4+ cells between wt and Act mice (Mann–Whitney test). (e,f) Sections from back skin after eight TPA applications stained with Foxp3 antibodies. (e) Arrows indicate Foxp3+ cells. (f) Epidermal Foxp3+ cells per mm of BM. N=7; n=6–25; ***P=0.0006 (Mann–Whitney test). (g,h) Sections from back skin after 20 TPA applications stained with langerin antibodies. (g) Arrows indicate langerin+ cells. (h) Langerin+ cells per mm of BM. N=7–10; n=3–25; **P=0.0012 (Mann–Whitney test). Representative sections are shown in (a), (c), (e) and (g), and the dermal–epidermal border is indicated by dotted lines. Nuclei were counterstained with Hoechst (a), (c), and (e) or propidium iodide (g). Bars: 25 μm. Scatter plots and mean values are shown in (b), (f) and (h).

