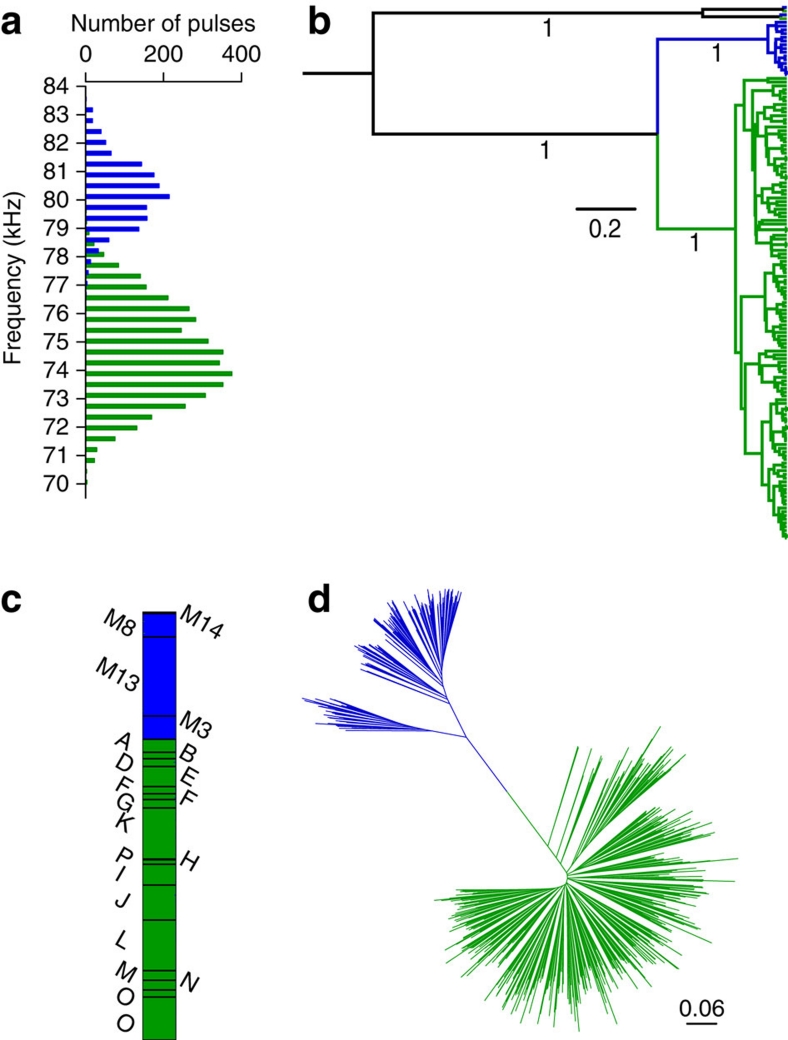
Figure 2. Distinction between Thailand and Myanmar populations.
(a) Distribution of echolocation calls recorded in Thailand (green; n=4,188) and Myanmar (blue; n=1,472). (b) Bayesian phylogenetic tree based on a 1.8-kb mitochondrial fragment of 602 samples and two different NUMTs (mitochondrial pseudogenes) showing the monophyly of the Thai (green) and Myanmar (blue) C. thonglongyai. The tree is rooted with two distinct NUMTs found in both populations. Bayesian posterior probabilities are shown below branches of interest. (c) Graphical representation of 196 Myanmar and 463 Thai individuals according to their probability to belong to each of the two clusters defined by STRUCTURE (black lines separate individuals sampled at different colonies). (d) Neighbour-Joining tree showing the relationships between 196 Myanmar (in blue) and 463 Thai (in green) individuals based on 15 microsatellites (Da distance).

