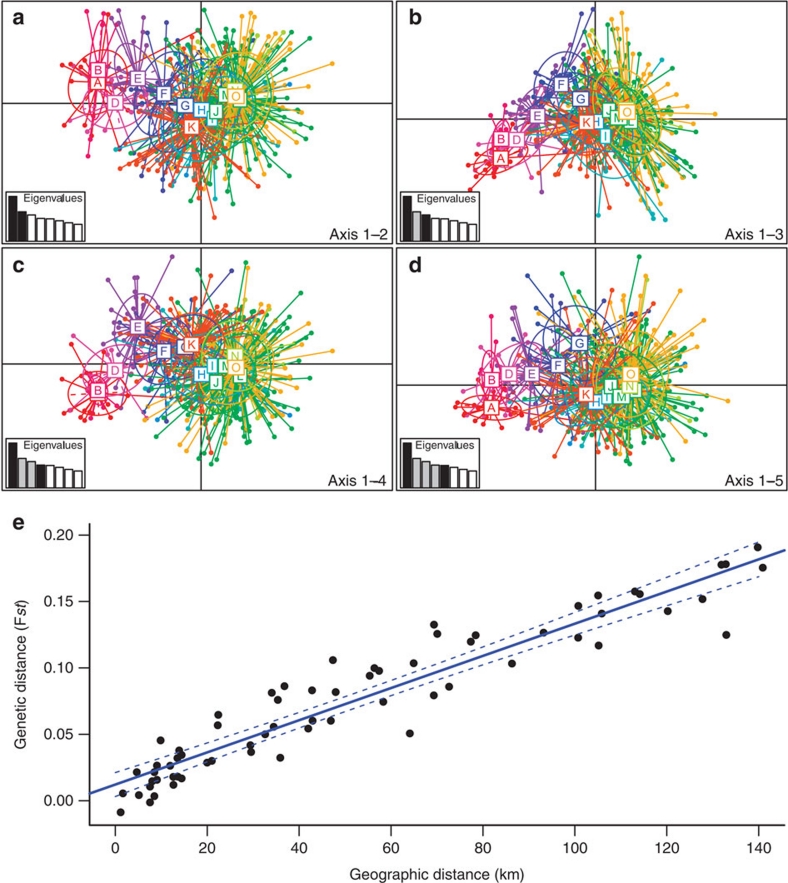
Figure 3. Population structure within Thailand.
Principal component analysis (PCA) showing the population structure of individuals orientated along the Northwest–Southeast direction with the first axis (explaining 8.46% of the variance) versus the (a) second axis (5.56%), (b) third axis (4.97%), (c) fourth axis (4.34%) and (d) fifth axis (4.24%). For each graph, the inset represents the eigenvalues of the two axes. Individuals from each of the 14 colonies are represented in different colours, and the colonies range from A in the Northwest to O in the Southeast. Colony P was excluded from the PCA, as only single individual was available from this site. (e) Relationship between genetic distance (Fst) versus geographic distance for the 12 colonies with echolocation and genetic data in Thailand (n=442 individuals). Significance was tested using a Mantel test (r=0.95, R2=0.90, P<0.001).

