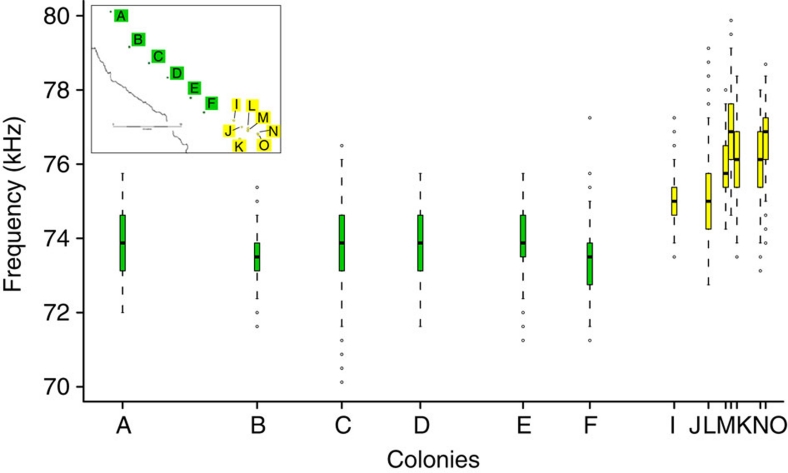
Figure 4. Echolocation call variation within Thailand.
Graph showing the variation in frequency of free flying C. thonglongyai recorded at different colonies represented on the inset map. Colonies are arranged on the X axis according to their score at the first axis (explaining 98.9% of the variance) of a principal component analysis on their geographic coordinates (latitude, longitude). For each boxplot, the box represents the 0.25 quantile, median and 0.75 quantile. On either side of the box, the whiskers extend to the minimum and maximum. To showcase possible outliers, whiskers were shortened to a length of one time the box length. The colours in the plot correspond to the colours in the inset map.

