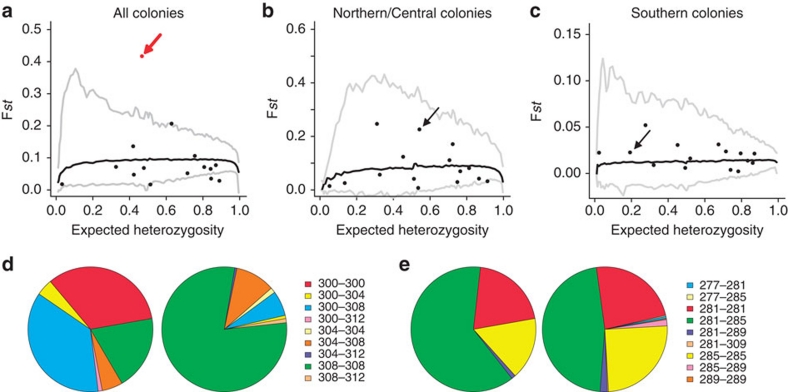
Figure 5. Results of Fst outlier approach detecting microsatellites deviating from model of neutral evolution.
Solid back lines represent the average expected distribution under a neutral model, and the grey lines indicate the upper and lower 99% confidence interval for the expected. Each dot represents a microsatellite locus (the locus CTC1 is indicated by an arrow), red dots identifying candidates under positive selection, (a) for all investigated colonies, (b) for colonies North of the area of abrupt echolocation change (colonies A to F), and (c) for colonies South of the area of abrupt echolocation change (colonies G to O). Genotype frequencies are represented for Northern/Central (left) and Southern (right) colonies in Thailand, for two loci, (d) under selection (CTC1) or (e) evolving neutrally (CTC104).

