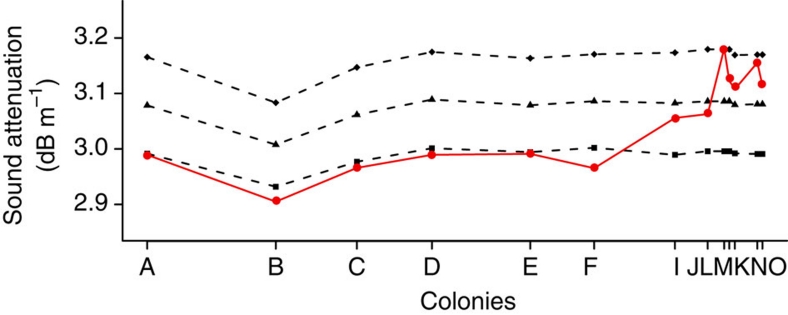
Figure 6. Sound attenuation for the different colonies.
Sound attenuation is higher for Southern colonies using higher frequencies. The attenuation for the observed frequency (red) shows a higher variability compared with calculated attenuation if colonies had a similar frequency (74 kHz, squares; 75.5 kHz, triangles; 77 kHz, diamonds). Colonies are arranged on the X axis according to their score at the first axis (explaining 98.9% of the variance) of a principal component analysis on their geographic coordinates (latitude, longitude).

