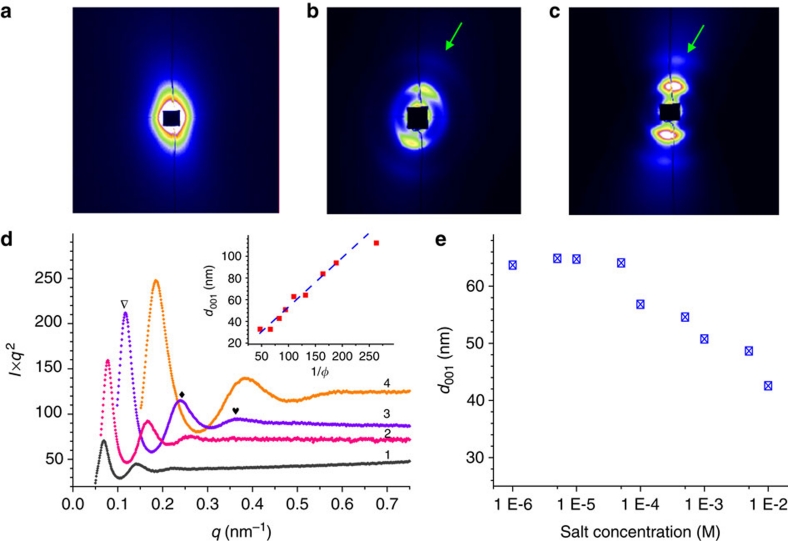
Figure 2. SAXS investigation of GO aqueous dispersions.
(a–c) 2D scattering patterns of GO dispersions with successive volume fractions (φs) of 0.38, 0.91 and 1.5%. The diffusive arcs (arrows) in b and c denote the reflection arcs. (d) Profiles of scattering intensity as a function of scattering vector q (q=4πsinθ/λ=2π/d) in samples with successive φs of 0.38, 1.06, 1.51 and 2.12% (successively numbered by 1–4). The triangular, diamond and heart signals denote the first-, the second- and the third-order scattering peaks in order. Inset: the correlation of d(001) spacing and 1/φ; the red dots are experimental values and the blue line is the fitting function in the linear region (φ≥0.5%). (e) Variation of the interlayer spacing d with salt concentration at φ=1.0%.

