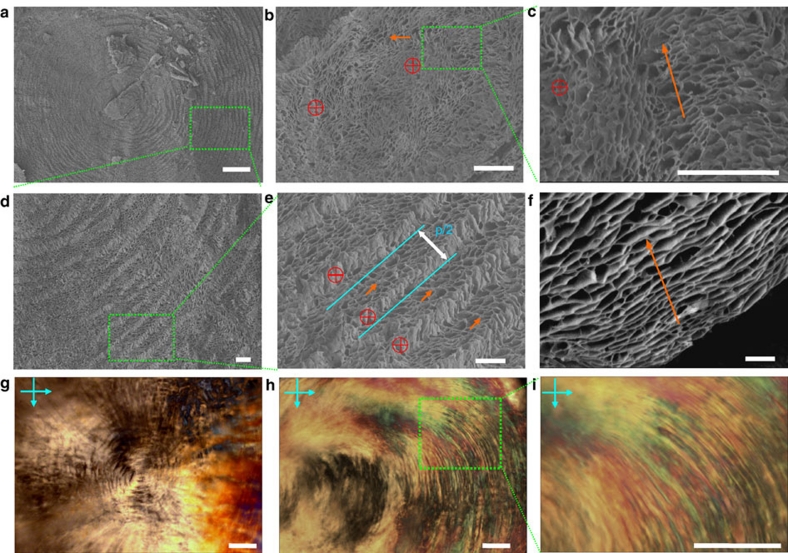
Figure 4. Cryo-SEM images and POM textures for GO CLCs.
(a–e) Top-view SEM images show the fracture morphology of GO CLCs at volume fraction φ 0.98% confined in a circular cavity. The red crosses denote vectors (ns) into the paper and the orange arrows on the paper. (b) The central domain in a.(c) The screw dislocation of neighbouring GO lamellar blocks with twist vectors. (f) Side-view SEM image of assembled GO blocks. (g–i) POM images between crossed polarizers of GO CLCs in central (g) and lateral (h,i) domains. The regular ring textures (g–i) are in accordance with the annual-ring undulating fracture morphology (a–e) of GO CLC. Scale bars, 200 μm (a), 25 μm (b–f) and 300 μm (g–i).

