
Figure 5.
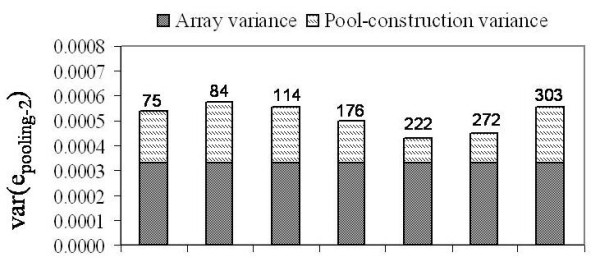
Decomposition of pooling variance for Illumina 660-Quad arrays. Stacked barplots showing the normalized pooling variance estimates, and the breakdown into array and to pool-construction variance for pools allelotyped on the Illumina 660-Quad array. All estimates are derived from comparison of non-identical pools, Type C. The portion of pooling variance attributed to pool-construction is indicated by hatched bars, the portion of pooling variance attribute to the array is indicated by grey bars. Pool size is indicated above each stacked bar.