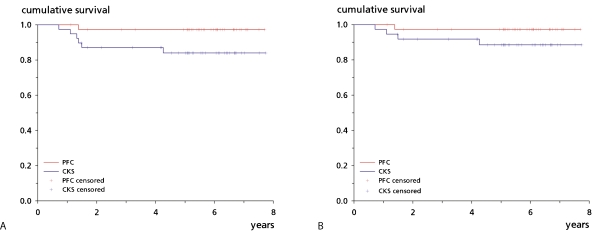
Figure 3.
Kaplan-Meier survival plots. A. With revision for any reason as endpoint, the PFC group had a survival of 97% (95% CI: 92–100) after 8 years and the CKS group had a survival of 84% (72–96) (p = 0.05). B. With aseptic revision as endpoint, the PFC group had a survival of 97% (92–100) after 8 years and the CKS group had a survival of 89% (78–99) (p = 0.2).

