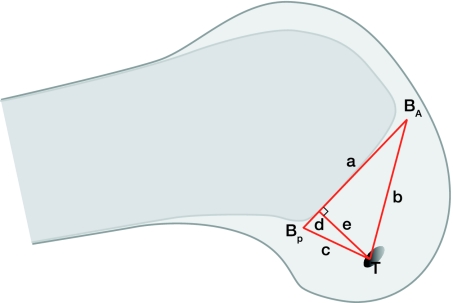
Figure 5.
View of the lateral femoral condyle. The red triangle is used in the 3D visualization technique calculations. a = line equal to Blumensaat's line. BA = the most anterior point of Blumensaat's line. BP = the most posterior point. T = tunnel entrance. e = the line perpendicular to a, from the tunnel entrance. Lines b and c are the lines connecting T with Ba and Bp, respectively. This makes it possible to calculate the length of d, thus giving a percentage of the AP positioning of the tunnel position on the Blumensaat line comparable to Aglietti's method.

