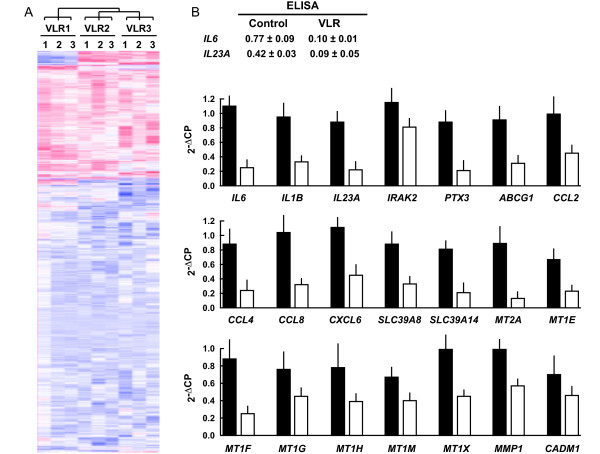
Figure 1.
Effects of VLR on gene expression. A, all-gene expression clustering in VLR-stimulated THP-1 macrophages compared to controls - i.e. no VLR - following a 24 h-challenge. VLR1-VLR3, individual lipoprotein preparations, each in triplicate. Blue and red, relatively down- and up-regulated genes, respectively. Clustering shows consistent differences between control and VLR-stimulated cells. Notice the excess of VLR-down-regulated genes compared to up-regulated ones. B, validation of array gene expression data by ELISA for IL-6 and IL23 p19 (indicated with gene symbol IL23A for simplicity; data are indicated as ng/ml/106 cells) and by qRT-PCR (graphs below ELISA values). Genes are ordered according to the functional grouping criteria of Table 1. qRT-PCR y-axis values are 2-ΔCP in comparison with the average of the GAPDH CP triplicates. Black bars, control; white bars, VLR-stimulated. Bars, standard deviations. P < 0.05 in all cases.

