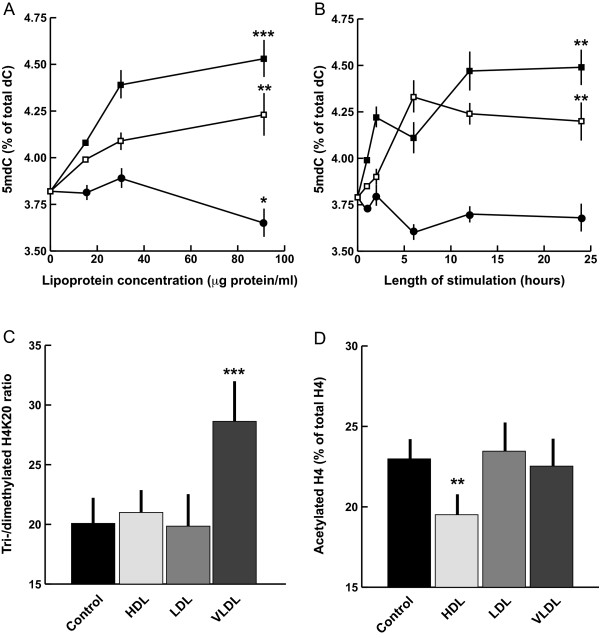
Figure 3.
Epigenetic responses to individual lipoproteins. A, dose-response for global DNA methylation. Solid squares, VLDL; open squares, LDL; solid circles, HDL. 5 mdC, 5-methyldeoxycytosine. For simplicity, significance levels are shown only for highest dose-responses compared to respective controls. B, time-course of global DNA methylation response following stimulation with individual lipoprotein at 91.1 μg protein/ml concentration. Symbols as in A. C and D, effects on histone posttranslational modifications. Significance levels are for comparisons with the respective control. One, two and three stars indicate P < 0.05, P < 0.01 and P < 0.005 significance level, respectively (Scheffé test). Bars, standard deviations.

