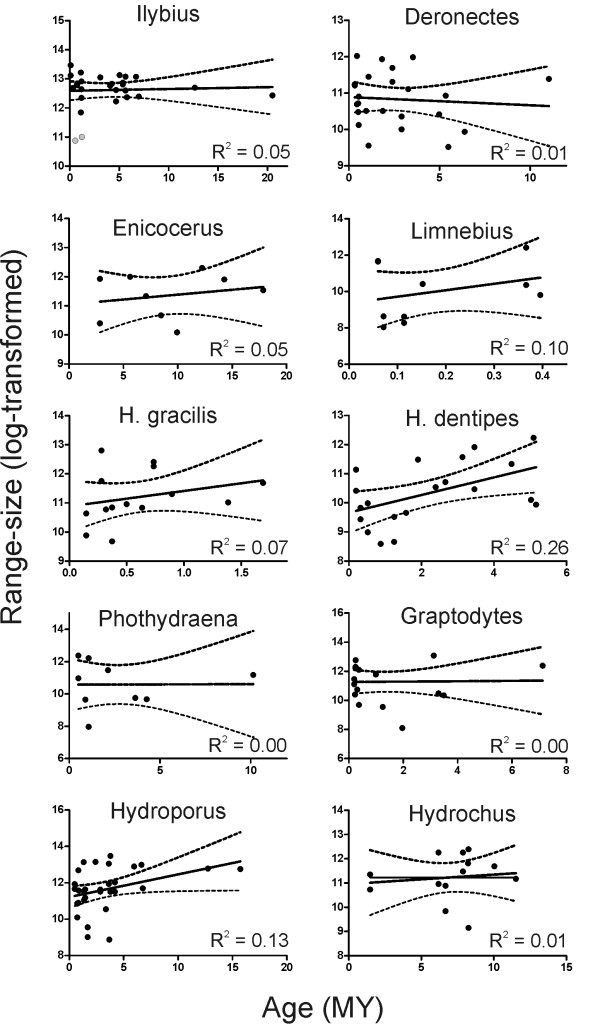
Figure 2.
Range size against species age. Plots of geographic range size against species age (Myr). The coefficient of determination is provided. With the single exception of H. dentipes, slope was not significantly different of 0 in all the studied lineages. The regression line and the 95% confidence interval are also displayed. Grey dots are outliers.

