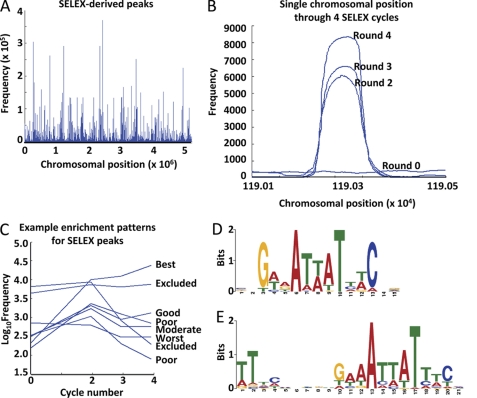
FIGURE 7.
Analysis of SELEX Illumina sequencing results. A, the fourth enrichment of SELEX was sequenced, and results were aligned to the genomic sequence of strain CFT073 using a local BLAST. Frequencies of a sequence read at every chromosomal position were plotted using a dot plot. B, dot plot of frequencies across SELEX rounds zero, two, three, and four in the chromosomal vicinity of a prototypical low frequency best grade peak. C, representative example of chromosomal peak positions and their frequencies plotted against SELEX rounds zero, two, three, and four. Grades of peaks are based on their pattern of frequencies across rounds and appear to the right (defined in the footnotes to Table 2). The MEME suite of sequence analysis tools was employed to determine if motifs were present in the list of 366 best grade peaks, generating two significant motifs. D, position weight matrix present in 362 of the 366 best grade peaks, E value 4.5 × 10−142. E, position weight matrix present in 269 of the 366 best grade peaks, E value 4.7 × 10−140.

