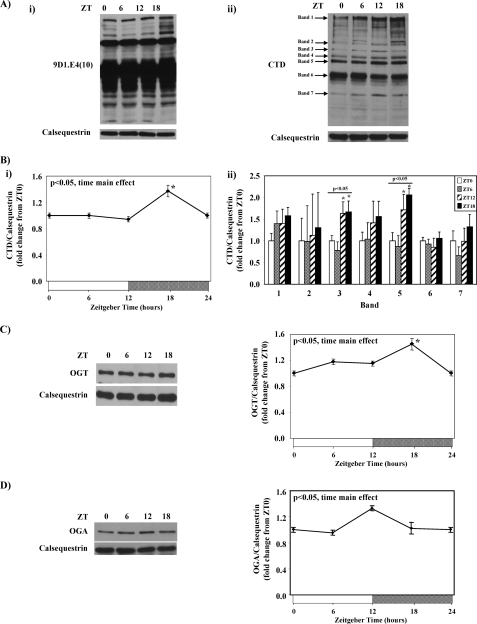
FIGURE 1.
Diurnal variations in mouse heart protein O-GlcNAcylation using the anti-O-GlcNAc antibody 9D1.E4(10) (i) or CTD (ii) (A) is shown. Densitometric analysis of total protein O-GlcNAcylation (i) as well as seven distinct O-GlcNAc protein bands (ii) in the mouse heart (B) is shown. Diurnal variations in OGT (C) and OGA (D) protein levels in the mouse heart are shown. Hearts were isolated at the dark-to-light phase transition (ZT 0), middle of the light phase (ZT 6), light-to-dark phase transition (ZT 12), and middle of the dark phase (ZT 18); ZT 0 and ZT 24 are identical data points. ZT represents zeitgeber time. Data are shown as the mean ± S.E. for between 14 and 20 separate hearts within each group. The main effects for time are indicated in the top left hand corner of the figure panels. *, p < 0.05 for a specific time point versus the trough (i.e. lowest) value.

