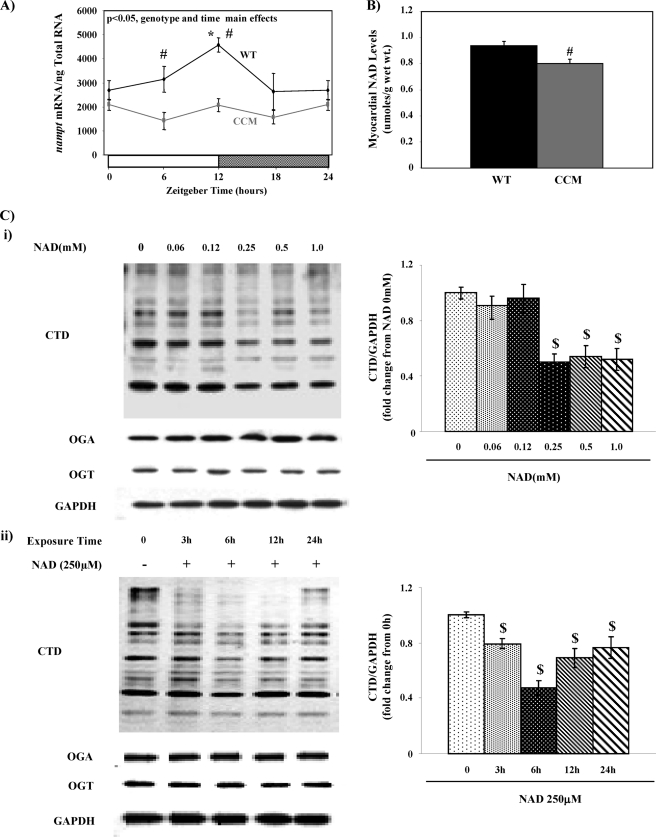
FIGURE 4.
Influence of NAD on protein O-GlcNAcylation. Diurnal variations in nampt mRNA levels in WT versus CCM hearts (A) are shown. NAD levels in WT versus CCM hearts at ZT18 (B) are shown. Concentration- and time-dependent effects of NAD on protein O-GlcNAcylation as well as OGT and OGA expression in neonatal rat ventricular cardiomyocytes (C) are shown. Hearts were isolated at the dark-to-light phase transition (ZT 0), middle of the light phase (ZT 6), light-to-dark phase transition (ZT 12), and middle of the dark phase (ZT 18); ZT 0 and ZT 24 are identical data points. ZT represents zeitgeber time. Data are shown as the mean ± S.E., for between five and six separate hearts/experiments within each group. Main effects for model, time, or genotype are indicated in the top left-hand corners of figure panels. *, p < 0.05 for a specific time point versus the trough (i.e. lowest) value. #, p < 0.05 for WT versus CCM at a distinct ZT. $, p < 0.05 for a specific NAD challenge compared with control.

