FIGURE 5.
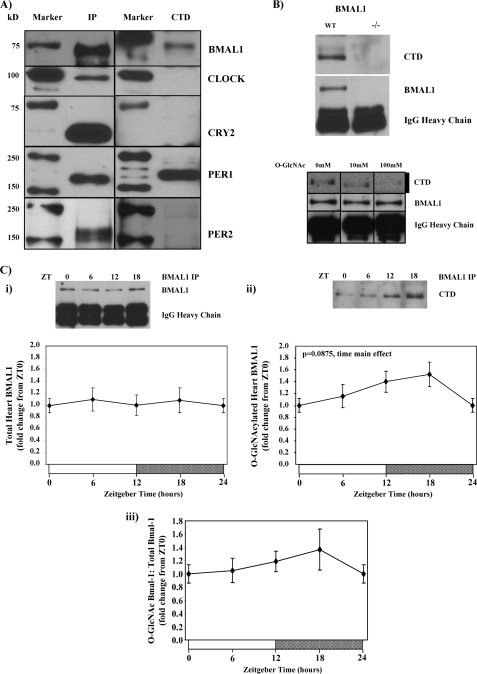
Identification of O-GlcNAc-modified clock components. Screening clock components (BMAL1, CLOCK, CRY2, PER1, and PER2) for O-GlcNAc modification in mouse livers is shown (A). The absence of BMAL1 O-GlcNAc modification in BMAL1 null mouse livers or after CTD-binding blockage with O-GlcNAc (10 or 100 mm) (B) is shown. Diurnal variations in Bmal1 O-GlcNAcyation in hearts (D) is shown. Hearts were isolated at the dark-to-light phase transition (ZT 0), middle of the light phase (ZT 6), light-to-dark phase transition (ZT 12), and middle of the dark phase (ZT 18); ZT 0 and ZT 24 are identical data points. ZT represents zeitgeber time. Data are shown as the mean ± S.E. for between 6 and 14 separate hearts/livers within each group. Main effects for time are indicated in the top left-hand corners of figure panels. *, p < 0.05 for a specific time point versus the trough (i.e. lowest) value. IP, immunoprecipitation.

