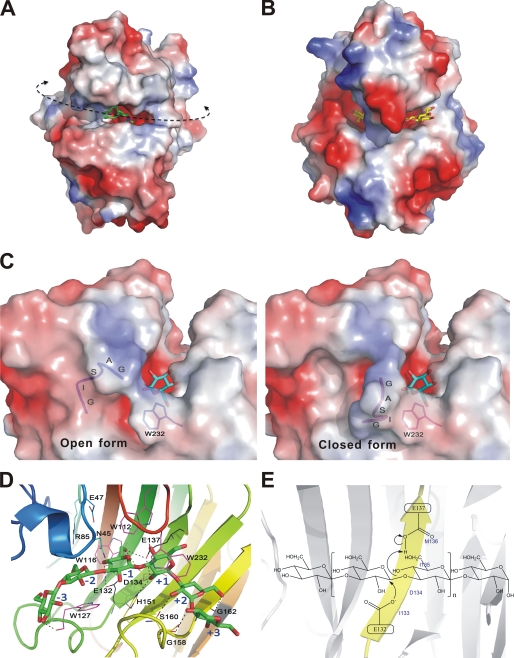
FIGURE 3.
Enzyme-carbohydrate interactions at the TmLamCD active site. A and B are electrostatic surface views of TmLamCD and TmCel12A, respectively. The ctab ligand is shown as green sticks, and the cellotetraose molecule is show with yellow sticks. The curved dashed line indicates the catalytic groove of TmLamCD, whereas the arrowheads show possible directions of a long chain substrate, the laminarin. C, electrostatic surface representation of the TmLamCD active site in complex with gluconolactone. The GASIG fragment located in a closed form is shown in magenta, and the open form is in blue. One of the double occupancies of Trp-232 was shown around the flexible loop, in which occupancy has no conflict over both open and closed forms. D, residues interacting with the modeled laminarihexaose by hydrophobic interaction are shown in magenta, whereas those forming hydrogen bonds are in yellow. Some nearby potential residues to interact with ligands are in cyan. The two catalytic Glu residues are drawn in black. Subsites of the pyranosides in the active site are labeled with blue text. E, depiction of the proposed mechanism for the retaining catalysis in TmLam. Both of the catalytic Glu residues are located on the B5 strand (in yellow).

