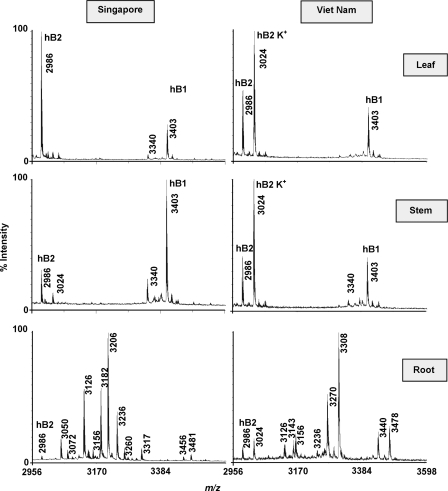
FIGURE 2.
Tissue- and region-specific distribution of cyclotides in H. biflora. Plant specimens were collected in two different countries: Singapore and Vietnam. They were divided into three different plant parts (leaf, stem, and root) and profiled separately by mass spectrometry. Peaks labeled K+ indicate the potassium adducts (+38 Da). Hedyotide B1 (hB1) and B2 (hB2) are labeled at the tops of the corresponding peaks.

