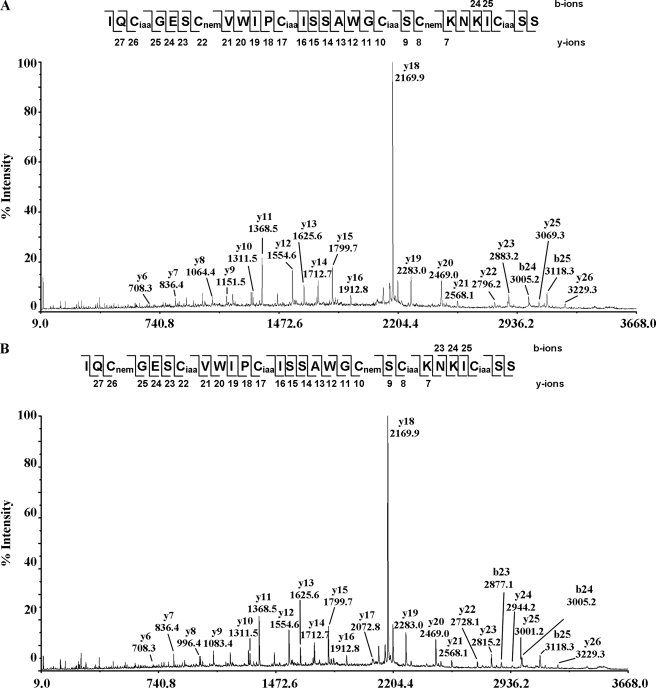
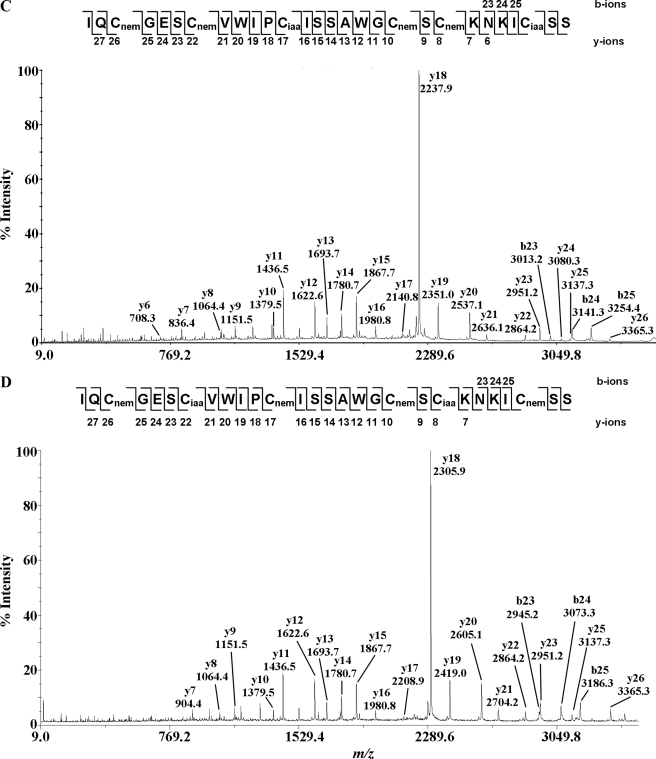
FIGURE 6.
MS/MS spectra of S-alkylated hedyotide B2 doubly S-tagged with IAA and NEM. A–D show the MS/MS spectra of S-alkylated derivatives of intermediate species in peaks 2, 3, 4, and 6, respectively. Peak 5 contains isoforms of intermediate species in peaks 4 and 6 with identical MS/MS spectra and was not shown here.


