FIGURE 2.
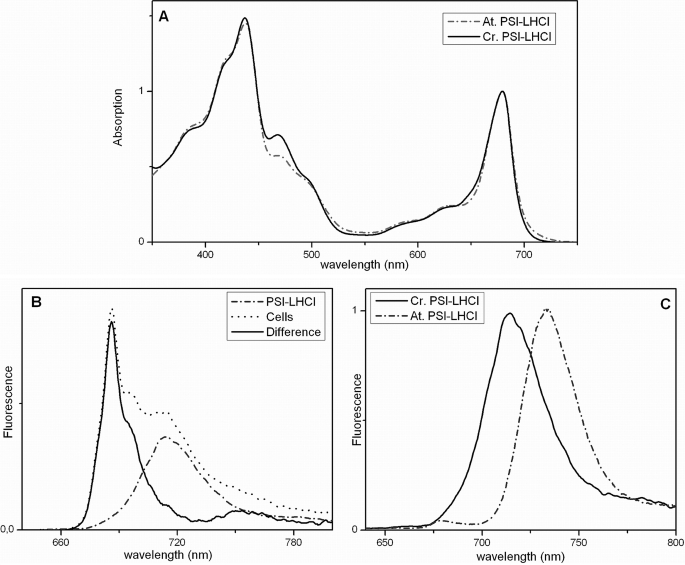
Room-temperature absorption (A) and 77 K fluorescence emission (B and C) spectra of C.r.PSI-LHCI (panels A and C, solid line; panel B, dashed line) compared with those of cells (panel B, dotted line) and A.t.PSI-LHCI (panels A and C, dashed line). Excitation used for fluorescence spectra was at 440 nm. The difference between normalized fluorescence emission spectra of cells and C.r.PSI-LHCI is shown in panel B (solid line).

