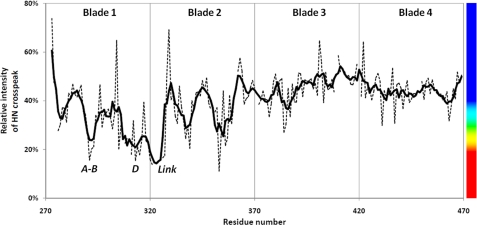
FIGURE 2.
HPX-1 line broadening upon addition of α1(I)772–787 THP. The sequence dependence of the HPX-1 backbone 1HN-15NH cross-peak broadening following an equimolar addition of THP is shown. The values show the intensity of cross-peaks at a 1:1 molar ratio of THP:HPX-1 relative to the sample of HPX-1 alone. The dashed lines show the raw data, whereas the thick solid line depicts a 5-residue roaming average of this data. The vertical lines show the approximate boundaries between the four blades of the HPX-1 β-propeller. The vertical bar on the right-hand side shows the rainbow color scheme used for the molecular representations in Fig. 3.

