FIGURE 6.
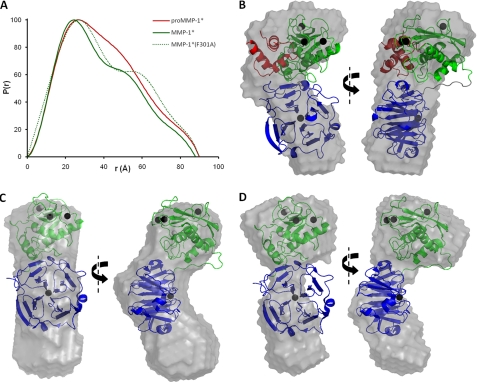
SAXS analysis of pro-MMP-1*, MMP-1*, and MMP-1*(F301A). A, the particle distribution functions, P(r), are shown for each protein. Note the increased Dmax (x intercept) and enhanced bilobal form of the F301A mutant relative to MMP-1*. B-D, orthogonal views of the average low resolution solution state models of pro-MMP-1* (B), MMP-1* (C), and MMP-1*(F301A) (D). In B, the SAXS model was overlaid automatically over the crystal structure of pro-MMP-1* (with an NSD of 1.65). In C and D, a manual overlay was performed over the crystal structure of MMP-1* as automated overlays gave unacceptably poor fits (NSD values of 2.07 and 2.11, respectively). In the crystal structures, the PRO domain is colored red, the CAT domain green, and the HPX domain blue. Note that, in C and D, unique orientations of the MMP-1* crystal structure with respect to the ab initio low resolution structures could not be identified due to the similar sizes of the CAT and HPX domains. Thus, their relative positioning here is arbitrary and only serves to highlight the discrepancy between solution-state and solid-state observations.

