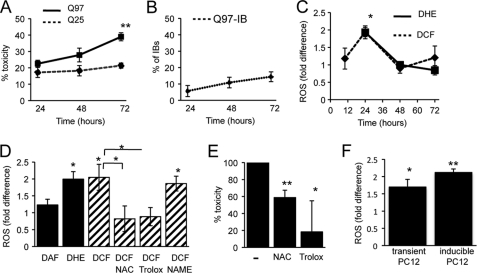
FIGURE 1.
Poly(Q) expanded httEx1 induces ROS before toxicity occurs. A, percentage of HeLa cells expressing httEx1Q25- or httEx1Q97mRFP with nuclear abnormalities. B, httEx1Q97mRFP-expressing cells with IBs (no IBs are formed by htEx1Q25mRFP). Means ± S.D. (error bars) are shown. C, -fold change of CM-H2DCF (DCF) or DHE oxidation in HeLa cells expressing httEx1Q97mRFP (DCF curve) or httEx1Q97EGFP (DHE curve) compared with httEx1Q25mRFP/EGFP. Means ± S.E. (error bars) are shown. D, -fold change in ROS at 24 h after transfection as in C (DAF used with mRFP constructs). l-NAC (1 mm), Trolox (0.1 mm), but not the NO inhibitor l-NAME (5 mm) suppressed httEx1Q97mRFP0-induced ROS. Means± S.E. are shown. E, percentage toxicity reduction 72 h after transfection with httEx1Q97mRFP by l-NAC (1 mm) or Trolox (0.1 mm). 100% toxicity is average difference in toxicity between httEx1Q97mRFP- and httEx1Q25mRFP-expressing cells with nuclear abnormalities. Means ± S.D. are shown. F, ROS induction at 24 h in httEx1Q97/Q25mRFP transiently transfected (transient PC12, DCF) or httEx1Q103/Q25EGFP tebufenozide-inducible cells (inducible PC12, DHE). Means ± S.D. are shown. A–F, n = 4–6 independent experiments. Student's t test (unpaired); *, p < 0.05; **, p < 0.01.

