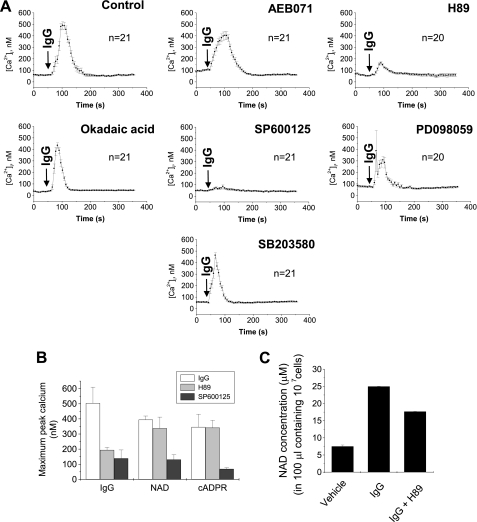
FIGURE 5.
The effect of inhibitors for signal transduction on FcγR stimulation, extracellular NAD+ or cADPR-induced [Ca2+]i increase. A, effect of inhibitors for signal transduction on FcγR stimulation-induced [Ca2+]i increase. IgG complex was added to Fluo-3/AM-loaded J774 cells that were pretreated with 1 μm AEB071, 100 nm H89, 5 μm okadaic acid, 5 μm SP600125, 5 μm PD098059, or 10 μm SB203580 for 10 min. [Ca2+]i changes were measured using a confocal microscope. Each line represents mean ± S.E. of [Ca2+]i. B. effect of 100 nm H89 and 5 μm SP600125 on FcγR stimulation, extracellular NAD+ or cADPR-induced [Ca2+]i increase. IgG complex, NAD+ or cADPR was added to Fluo-3/AM-loaded J774 cells that were pretreated with H89 or SP600125 for 10 min. [Ca2+]i changes were measured using a confocal microscope. The data represent mean ± S.E. of maximum peak [Ca2+]i. C, effect of H89 on FcγR stimulation-induced NAD+ secretion. J774 cells were pretreated with 100 nm H89 for 10 min and then treated with IgG complex for 1 min. After centrifugation, NAD+ in the supernatant was determined. The data represent mean ± S.E.

