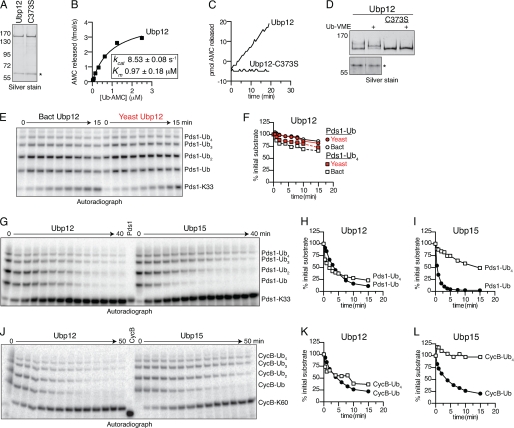
FIGURE 5.
Ubp12 shows little chain length selectivity. A, purity of recombinant Ubp12. Shown is a silver-stained gel showing 50 ng of the indicated Ubp12 isoforms after affinity purification from E. coli lysates. C373S indicates a catalytically inactive isoform of Ubp12 wherein the predicted catalytic Cys373 was mutated to Ser (9). The asterisk indicates a co-purifying protein that does not have DUB activity (see D). B, kinetic characterization of Ub-AMC hydrolysis by Ubp12. Recombinant Ubp12 (10 pm) was incubated with Ub-AMC (0.02–2.5 μm) for 30 min at room temperature, and the release of fluorescent AMC was monitored. Initial velocities were calculated and plotted against Ub-AMC concentration. Estimated values of Km and kcat were calculated using Prism. C, catalytic Cys373 is required for Ub-AMC hydrolysis by Ubp12. Ubp12, or Ubp12-C373S (33 pm) was exposed to Ub-AMC (2.5 μm) for 30 min at room temperature, and the release of fluorescent AMC was monitored. D, catalytic Cys373 is required for Ub-VME binding to Ubp12. Ubp12 or Ubp12-C373S (50 ng) was exposed to Ub-VME as shown for Ubp15 (Fig. 3C). The lower panel shows that the co-purifying 60 kDa protein does not react with Ub-VME. E, comparison of recombinant and endogenous yeast Ubp12. Time course of 125I-labeled Pds1-Lys33 deubiquitination by 30 nm recombinant (Bact) or 10 nm immunoprecipitated (Yeast) Ubp12. Pds1-Lys33 ubiquitin conjugates were made as in Fig. 2G. Deubiquitinated Pds1-Lys33 (bottom band) and bands corresponding to one or more ubiquitins on Pds1-Lys33 are indicated. F, quantitation of E. Levels of each ubiquitin conjugate are normalized to their initial values (in arbitrary units) at time zero. G–L, comparison of recombinant Ubp12 and Ubp15. Shown are time courses of ubiquitin removal from 125I-labeled Pds1-Lys33 (G) or 125I-labeled CycB-Lys60 (J) by 40 nm Ubp12 or 90 nm Ubp15 as described for E. H, I, K, and L are quantitation of data from G and J as described for F. See supplemental Table S1 for initial rates. All results are representative of two to three experiments.

