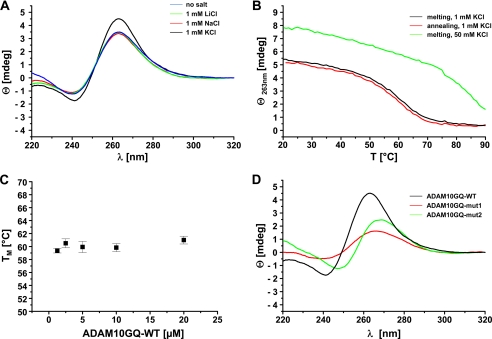
FIGURE 2.
Biophysical analysis of the ADAM10 G-quadruplex motif. A, CD spectra of 5 μm ADAM10GQ-WT oligonucleotide in the absence (blue) or presence of different monovalent cations (green, LiCl; red, NaCl; black, KCl; 1 mm each) in 10 mm Tris/HCl (pH 7.4), 0.1 mm EDTA. Note that the formation of a stable G-quadruplex structure was strongly induced in the presence of 1 mm KCl. B, CD melting experiments of 5 μm ADAM10GQ-WT in the presence of 1 mm KCl. Melting (black) and annealing (red) curves are almost identical and show a Tm of 60 ± 1 °C. In contrast, at 50 mm KCl (green), the folded G-quadruplex could not be unfolded at higher temperatures. C, plot of Tm values for ADAM10GQ-WT at various strand concentrations. All experiments were performed in the presence of 10 mm Tris/HCl (pH 7.4), 0.1 mm EDTA, and 1 mm KCl. Results are expressed as the mean ± S.D. of at least three different measurements. D, CD spectra in the presence of 1 mm KCl of ADAM10GQ-WT (black) and mutated variants thereof (red, ADAM10GQ-mut1; green, ADAM10GQ-mut2).

