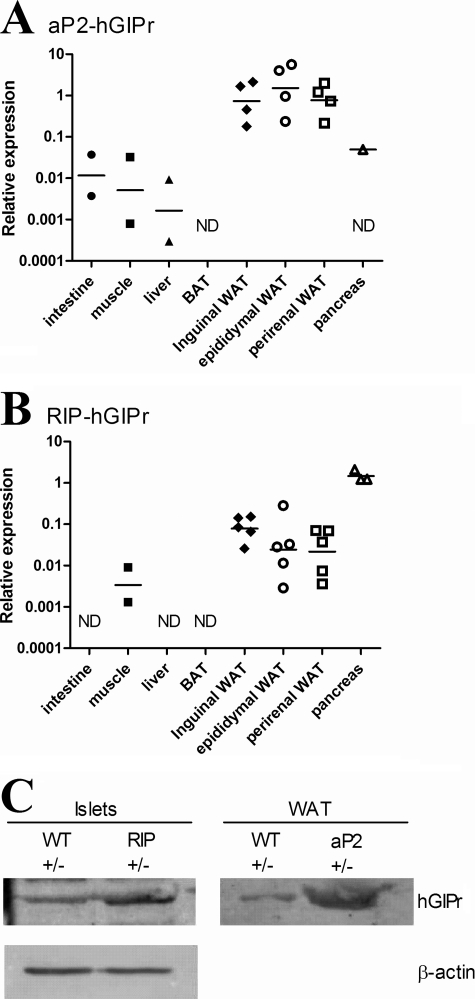
FIGURE 1.
Expression of the transgenic human GIPr in the aP2-hGIPr and RIP-hGIPr strains. The relative expression of the transgenic hGIPr in selected tissue are shown for the aP2-hGIPr strain (A) and RIP-hGIPr strain (B). Expressions are relative to GAPDH Ct values in the same sample, and all samples are normalized to an identical calibrator (inguinal WAT cDNA from an aP2-hgipr transgenic mouse). Each replicate is shown by a dot, and the line represents the geometric mean on a logarithmic scale. ND, not detected. C, expression of the transgene at the protein level was confirmed by Western blot analysis on lysates from isolated islets (pool of islets from two to three mice in each group) and WAT (pool of tissue from two mice in each group). Use of an antibody directed against the N terminus of human GIPr yielded a band migrating at an apparent mass of 65 kDa. Equal amount of protein was loaded in the WAT lanes as β-actin was found to precipitate in WAT lysates.

