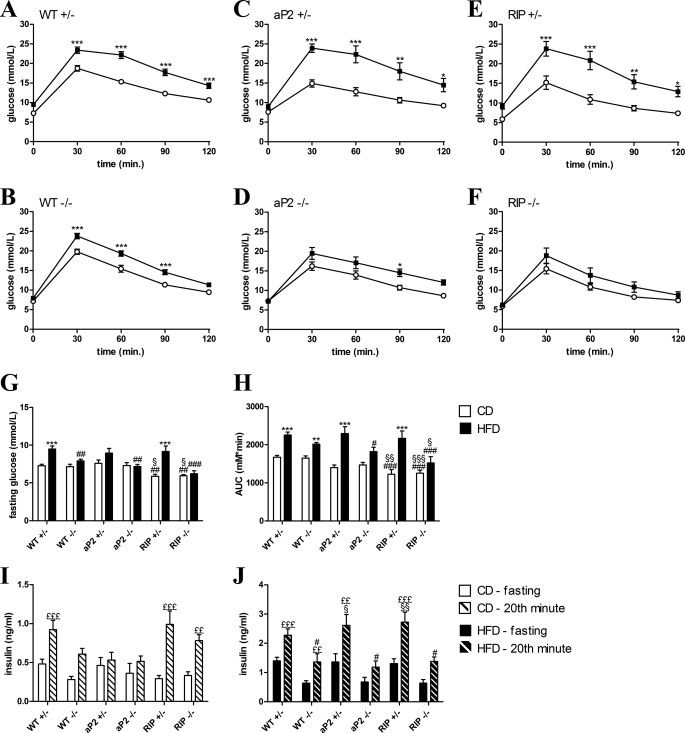
FIGURE 5.
Oral glucose tolerance tests. Mice fed a CD (white circles) or a HFD (black squares) for 20–22 weeks were given an oral glucose challenge after an overnight fast (16–18 h). Blood samples were taken from a tail vein at the indicated time points for measurement of glucose or insulin. A–F, glucose excursion curves are shown for each genotype fed a CD and HFD. G, fasting glucose levels after an overnight fast (16–18 h). H, AUC are shown for comparison of differences in glucose excursions. OGTTs for measurement of insulin were carried out in a separate experiment. A blood sample was taken 0 and 20 min after an oral glucose load for each genotype fed a CD (I), and a HFD (J). Data are shown mean ± S.E. For WT+/− and WT−/−, n = 19–35 per group. In other groups, n = 6–14. *, p < 0.05; **, p < 0.01; ***, p < 0.001; HFD versus CD; #, p < 0.05; ##, p < 0.01; ###, p < 0.001 versus WT+/− fed the same diet; §, p < 0.05; §§, p < 0.01 versus WT−/− fed the same diet. ££, p < 0.01; £££, p < 0.001 versus insulin fasting levels within the group.

