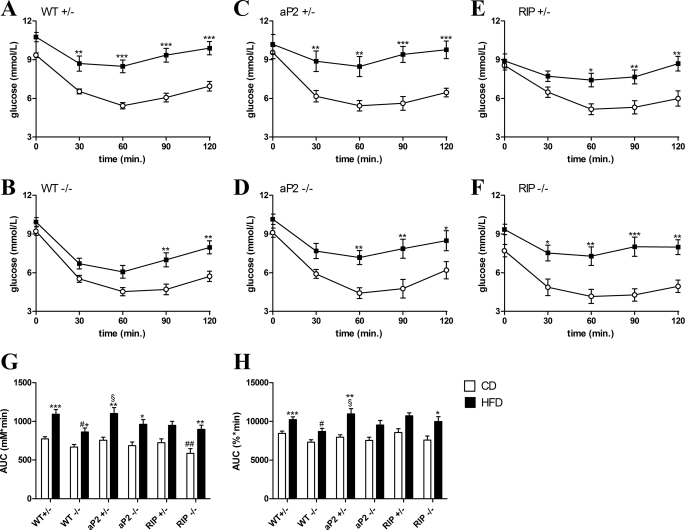
FIGURE 6.
Insulin tolerance test. Mice fed a CD (shown in white) or HFD (shown in black) for 23–24 weeks were fasted 4 h and given 0.3 units/kg insulin by intraperitoneal injection. Blood samples were taken from a tail vein at the indicated time points for measurement of glucose elimination. A–F, glucose excursion curves are shown for each genotype fed a CD and HFD. The AUC are shown for comparison of differences in glucose excursions. G shows the AUC calculated from the glucose concentrations over time, and H shows AUC calculated from glucose excursion curves shown as percentage of base-line blood glucose. Data shown are mean ± S.E. For WT+/− and WT−/−, n = 17–33 per group. In other groups n = 8–12. *, p < 0.05; p < 0.01; ***, p < 0.001, HFD versus CD; #, p < 0.05; ##, p < 0.01 versus WT+/− fed the same diet; §, p < 0.05 versus WT−/− fed the same diet.

