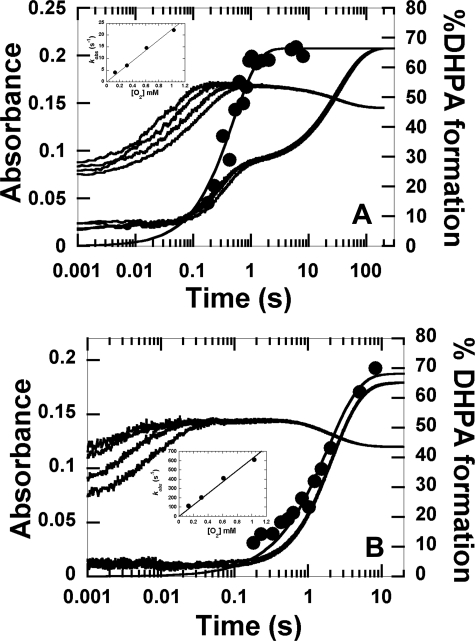
FIGURE 6.
Kinetics of the reactions of S146A·FMNH− and S146C·FMNH− with oxygen in the presence of HPA. A, A solution of S146A (40 μm)·FMNH− (16 μm)·HPA (2 mm) in 50 mm sodium phosphate (pH 7.0), was mixed with the same buffer containing the following oxygen concentrations, 0.13, 0.31, 0.61, and 1.03 mm, plus 2 mm HPA (concentrations after mixing). The kinetics of the reaction of S146A·FMNH−·HPA with oxygen at pH 7.0 was monitored by the change in absorbance at 390 and 446 nm. Traces at 390 nm are shown as the lower to the upper traces from low to high oxygen concentrations. The inset in A shows a plot of kobs of the second phase versus oxygen concentration with a bimolecular rate constant of 2.2 ± 0.1 × 10⁴ m−1s−1. The filled circles represent the DHPA formed, which was measured from rapid-quench experiments of the reactions of S146A·FMNH−·HPA with oxygen at pH 7.0, 4 °C. The plot is consistent with a single exponential curve with a rate constant of 3.9 ± 0.8 s−1. The percentage of DHPA accumulated at a reaction time of 8.03 min was 66 ± 2%. B, kinetic traces for the reaction of S146C·FMNH−·HPA with oxygen are shown. The experimental conditions used were similar to the reaction of S146A except that 20 mm HPA was used. The lower to upper traces at 390 nm are shown from low to high oxygen concentrations, whereas all traces at 446 nm were superimposed. The inset in B is a plot of kobs of the first phase versus oxygen concentration. The plot shows a linear relationship with a bimolecular rate constant of 6.2 ± 0.3 × 10⁵ m−1s−1. The filled circled trace is a plot of DHPA formed from the reaction of S146C versus reaction time in the rapid-quench instrument. The plot shows a single exponential curve with a rate constant of 0.52 ± 0.05 s−1. At a reaction time of 8.30 min, DHPA (68 ± 3%) was formed.

