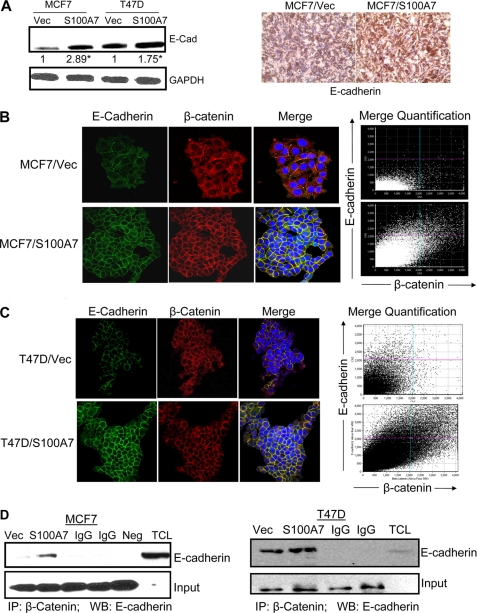
FIGURE 8.
S100A7 overexpression enhances the co-localization and interaction between β-catenin and E-cadherin in ERα+ breast cancer cells. A, left, 50 μg of cell lysates subjected to immunoblot analysis with anti-E-cadherin antibody and GAPDH. A, right, representative immunohistochemical staining for anti-E-cadherin in tumors derived from mice injected with MCF7/Vec or MCF7/S100A7 cells. B and C, localization of E-cadherin and β-catenin in MCF7/Vec, MCF7/S100A7 (B), or T47D/Vec, T47D/S100A7 (C) as determined by confocal microscopy. These cells were cultured in chamber slides, fixed, and treated with various antibodies, as described under “Experimental Procedures.” The slides were then mounted using Vectashield medium with 4′,6-diamidino-2-phenylindole (DAPI) and examined under an Olympus FV1000 filter confocal microscope. Graph shows the quantification of merged E-cadherin and β-catenin as analyzed by FV10-ASW 2.0 software (B and C, right). D, 500 μg of cell lysates from MCF7 (left) or T47D (right) vector control or S100A7-overexpressing cells were subjected to immunoprecipitation (IP) and probed with anti-E-cadherin antibody. The bottom panel shows the IgG band for input. IgG, immunoglobulin control for both vector and S100A7-overexpressing cells; Neg, negative control; TCL, total cell lysate; IP, immunoprecipitation; WB, Western blotting. All experiments were repeated three times, and a representative one is shown. *, p < 0.05 as calculated from Student's t test.

