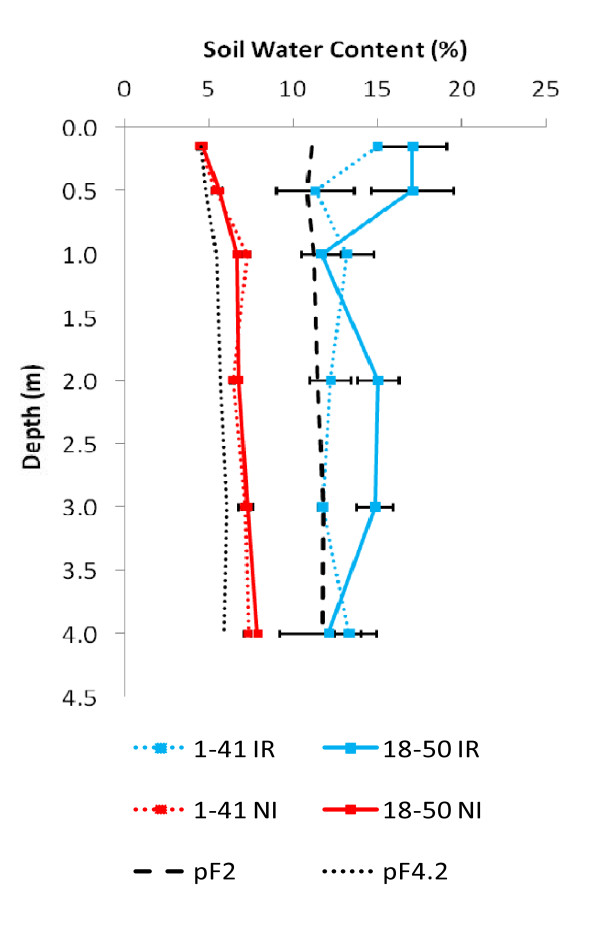
Figure 3.
Profile of soil water content (SWC). Means and standard errors of SWC at six depths, for both genotypes (G1 and G2), subjected to two water regimes (irrigated: IR and not irrigated: NI). SWC at wilting point (pF4.2) and at field capacity (pF2) were calculated from data obtained at a site close to the experimental field (Laclau, personal communication).

