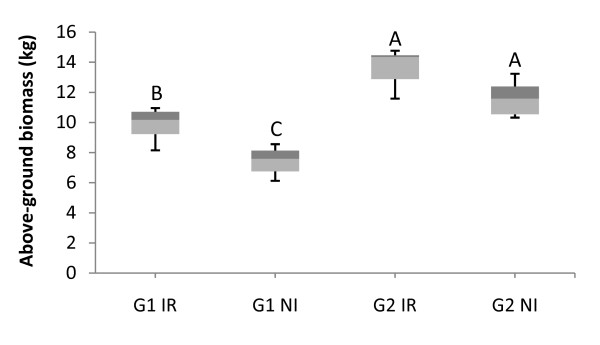
Figure 4.
Above-ground biomass. Box plot of above-ground biomass calculated for 11 trees per treatment, for both genotypes (G1 and G2), subjected to two water regimes (irrigated: IR and not irrigated: NI). Centre line and outside edge of each box indicate the median and range of inner quartile around the median, respectively; vertical lines on the two sides of the box represent the first and the ninth decile, respectively. Letters indicate the groups obtained in Bonferroni tests for multiple pairwise comparisons.

